Finding the performance bottleneck (CPU vs GPU)
To properly test performance:
- disable vsync (r.vsync 0)
- and frame limiter (t.MaxFPS 0)
- in UE 5.5 there is a bug and setting t.MaxFPS to 0 caps the FPS at 60. To overcome it, set t.MaxFPS to higher value, like 1000
- disable smooth framerate (Project > Engine > General Settings, disabled by default)
Stat command
or type in console:
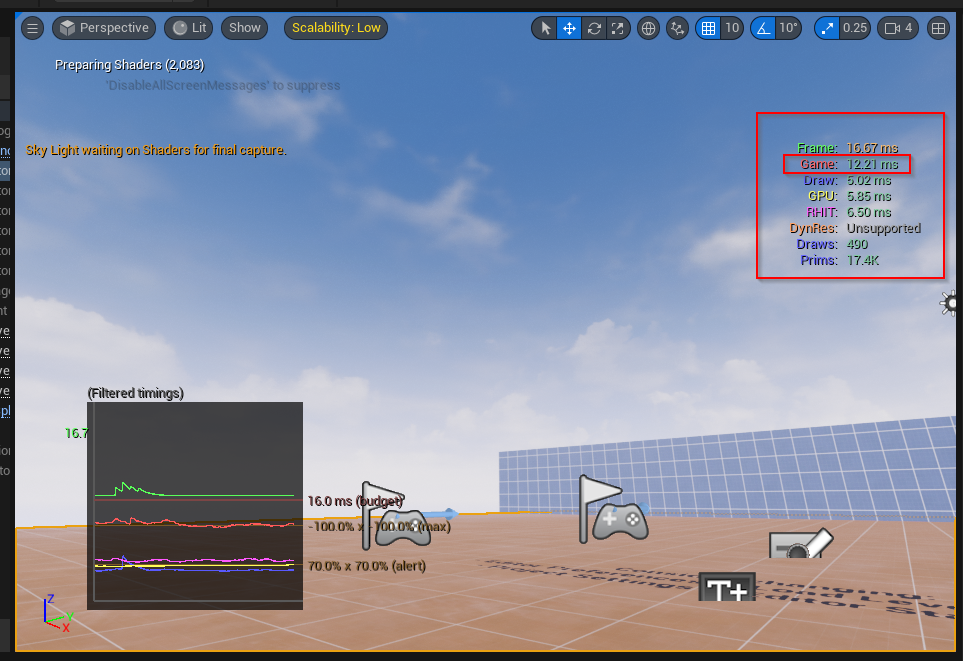
stat unit When looking at the unit stat, the frame is total time of frame. But look at the next ones. The biggest number will hint that this is the bottleneck. In case of this screenshot, the bottlenect might be the game thread: CPU.
To change the colors of the numbers, change: “t.UnacceptableFrameTimeThreshold <milliseconds>”
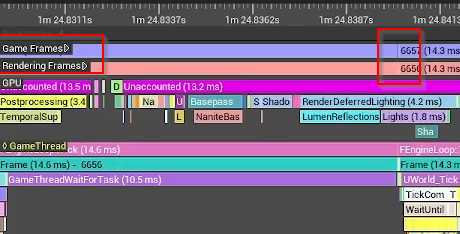
Stat unitgraph
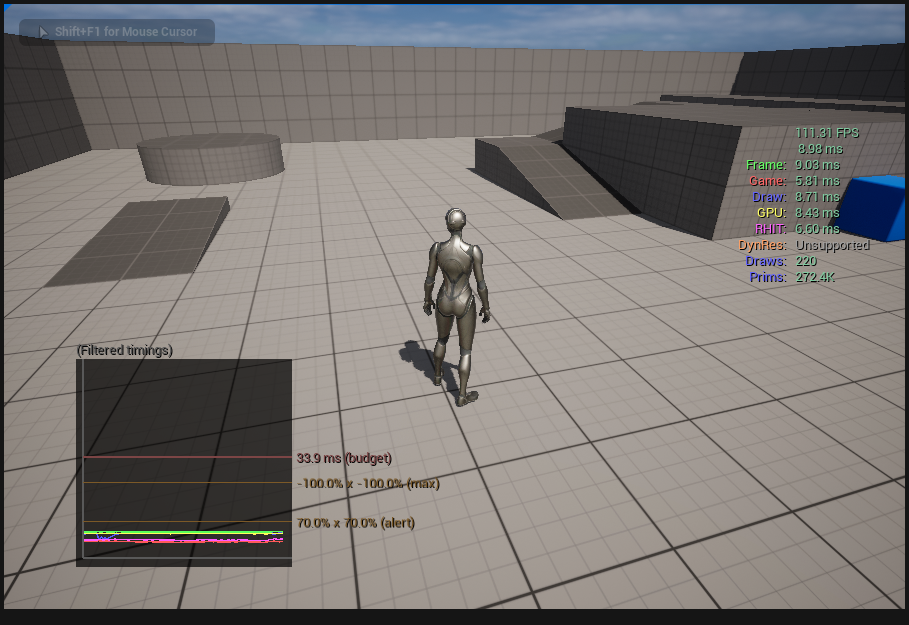
command
stat unitgraphTo change the budget, use console command: “t.TargetFrameTimeThreshold <milliseconds>”
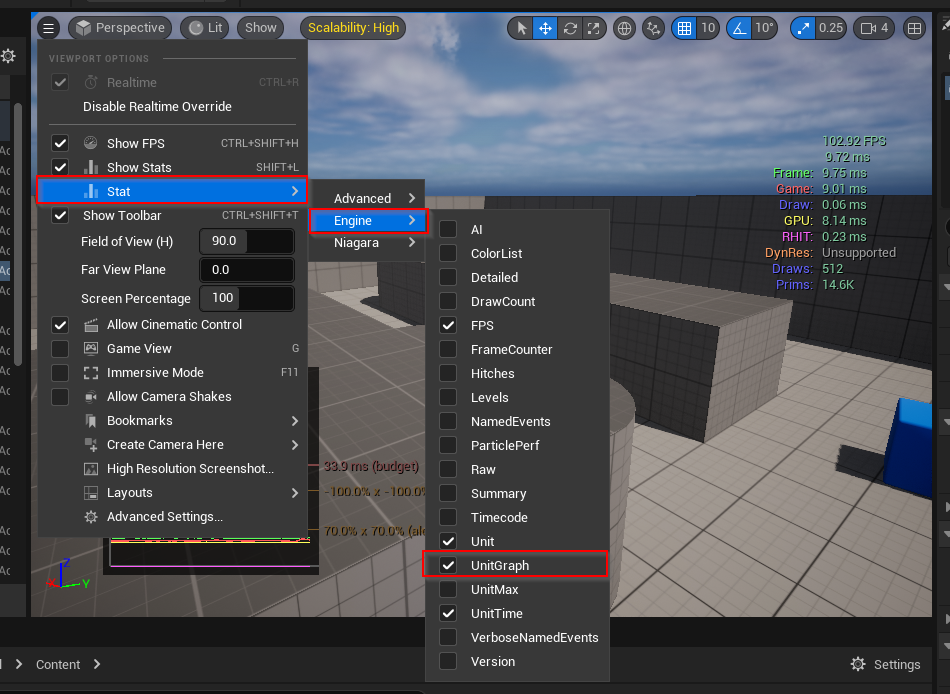
Here’s how to enable it:
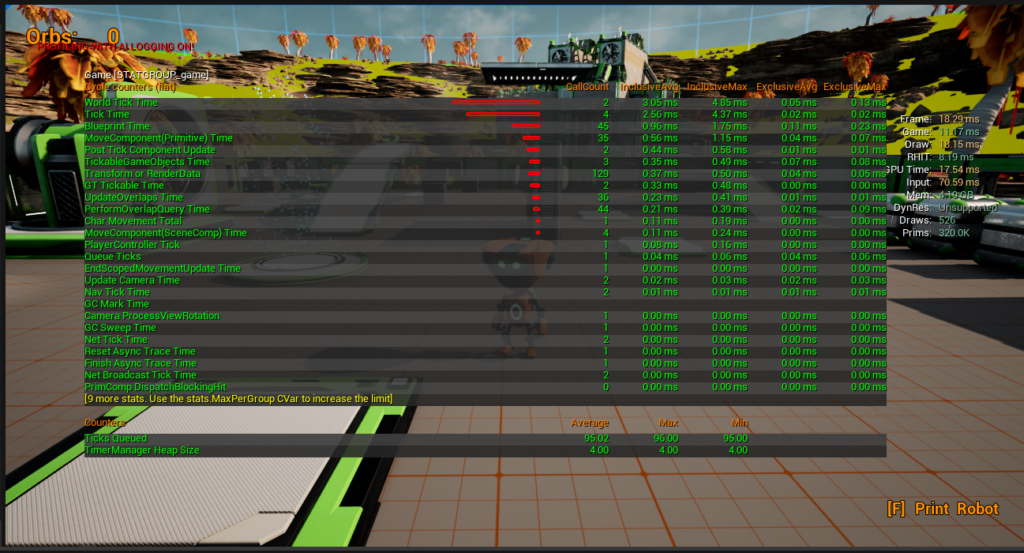
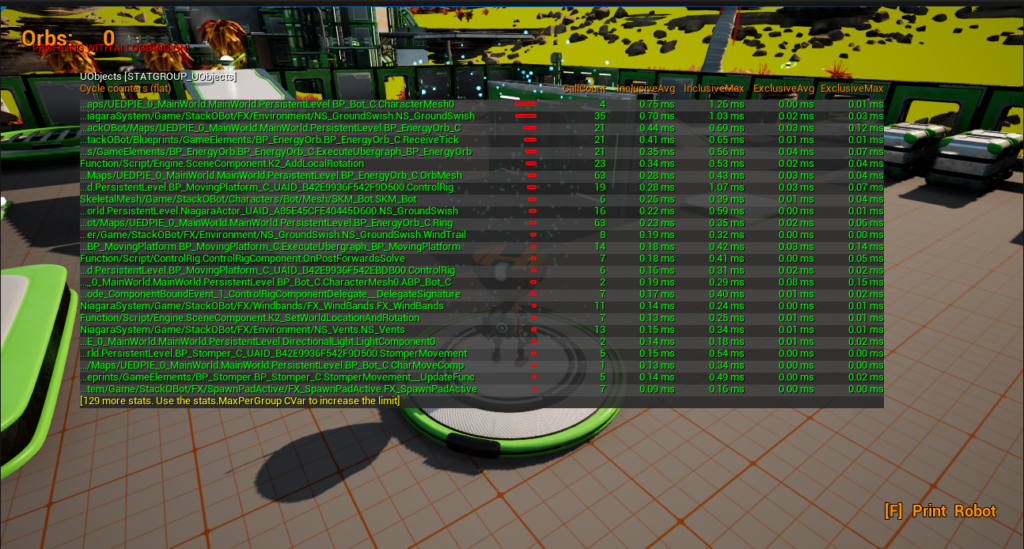
stat game” shows game related stats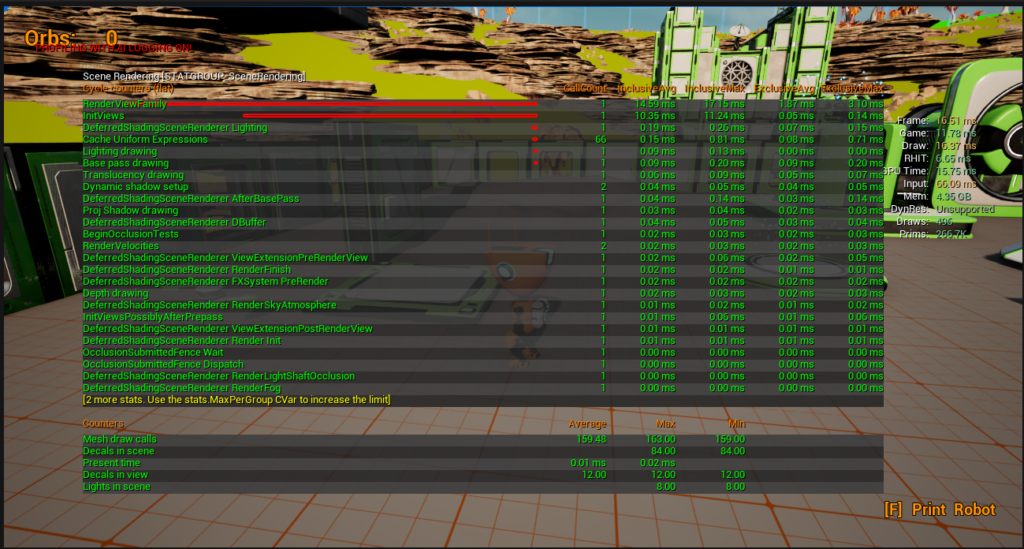
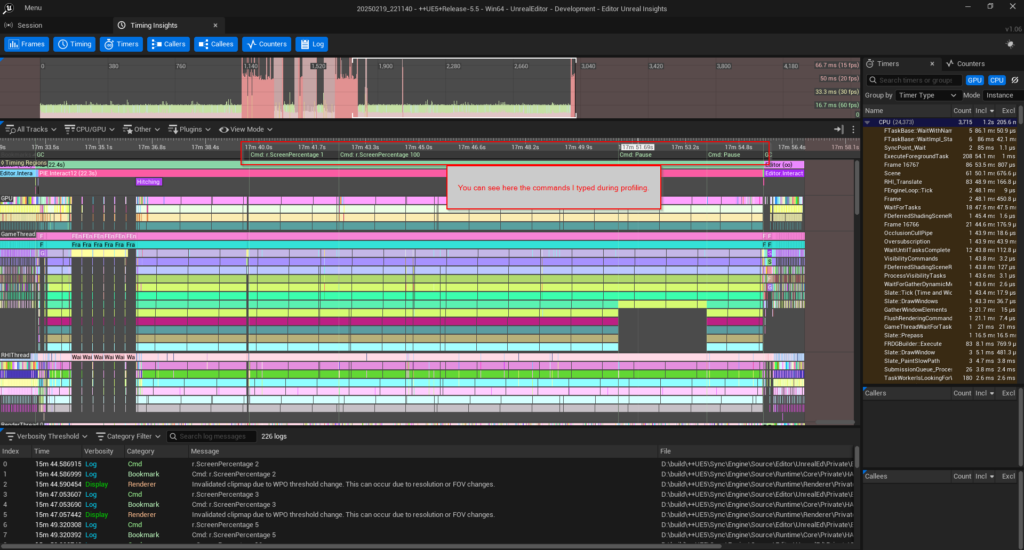
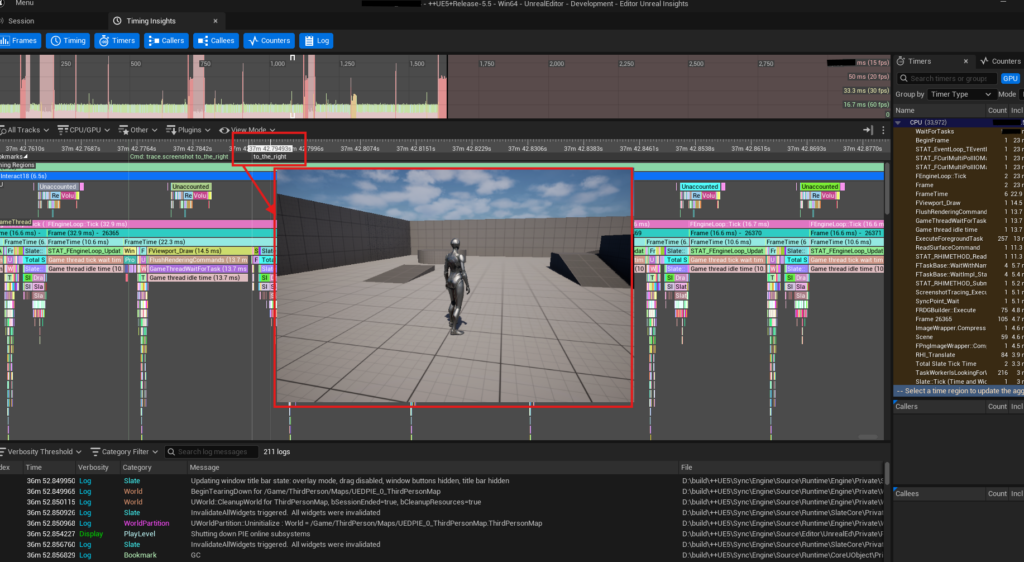
Unreal insights
For finding bottlenecks, look for CPU wait for tasks and in GPU gaps. Those will tell you how much this specific hardware is waiting.
Useful things to do when profiling:
- test GPU load – change screen resolution (r.screenpercentage 10)
- test CPU load – pause the game (pause)
- add more information to the profiling session: console command: “stat namedevents”
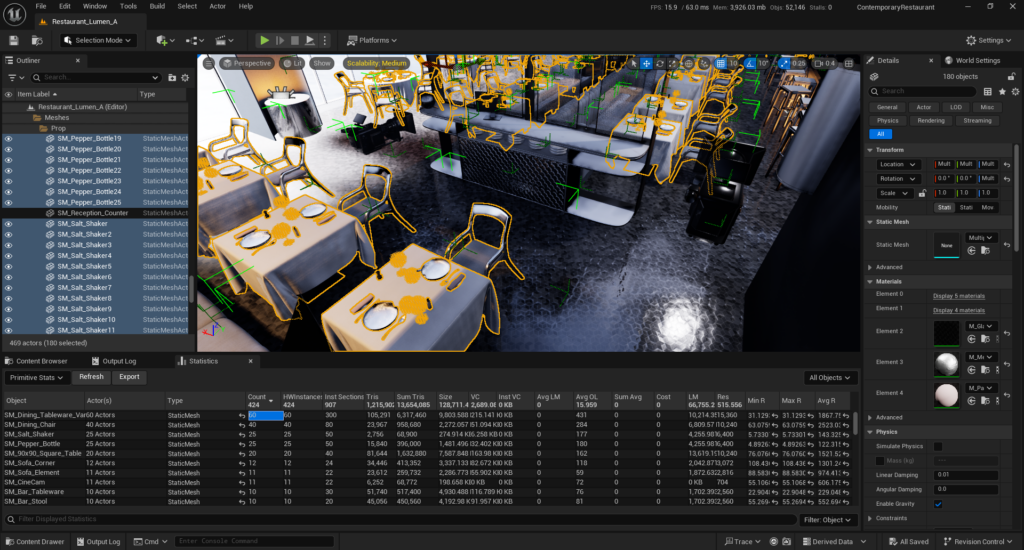
Tools -> Audit -> Statistics
ProfileGPU
This is a console command that you type during the game and scene you want profiled.
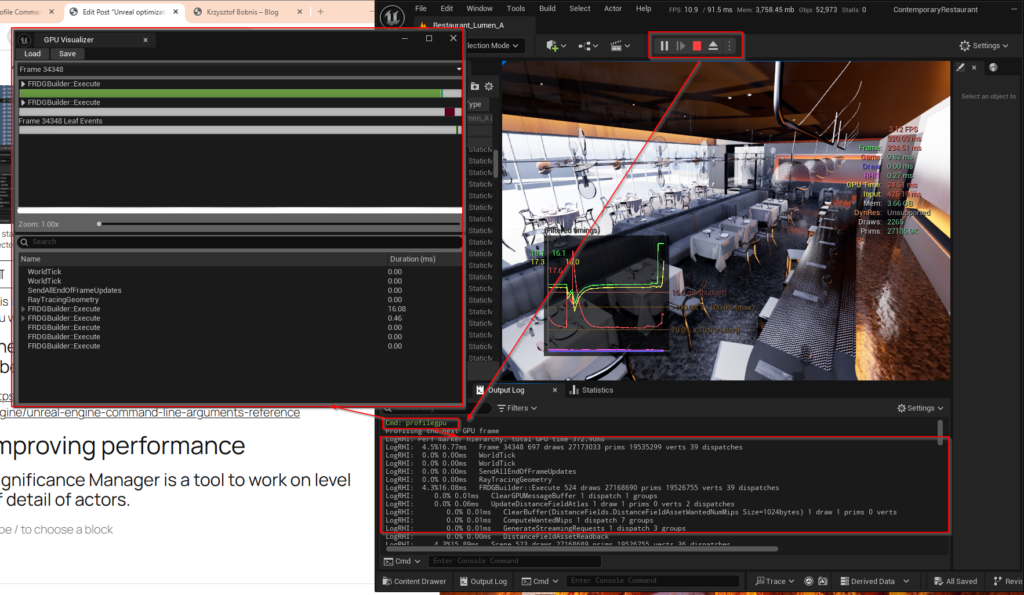
profilegpu . This will freeze the game for several seconds and then open GPU visualizer window and print logs to console.There is a benchmark launch arguments to run a benchmark level right from windows
View modes
Wireframe (shortcut F1)
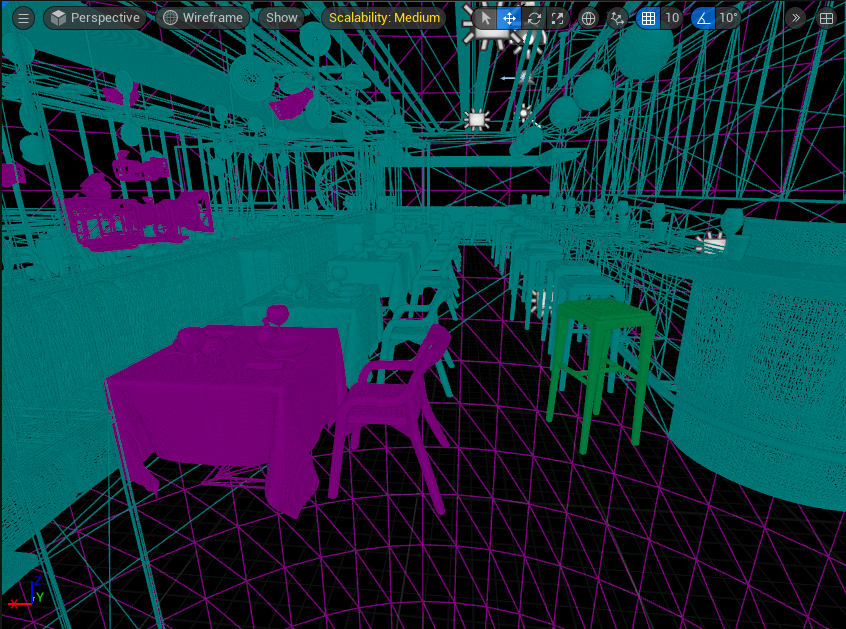
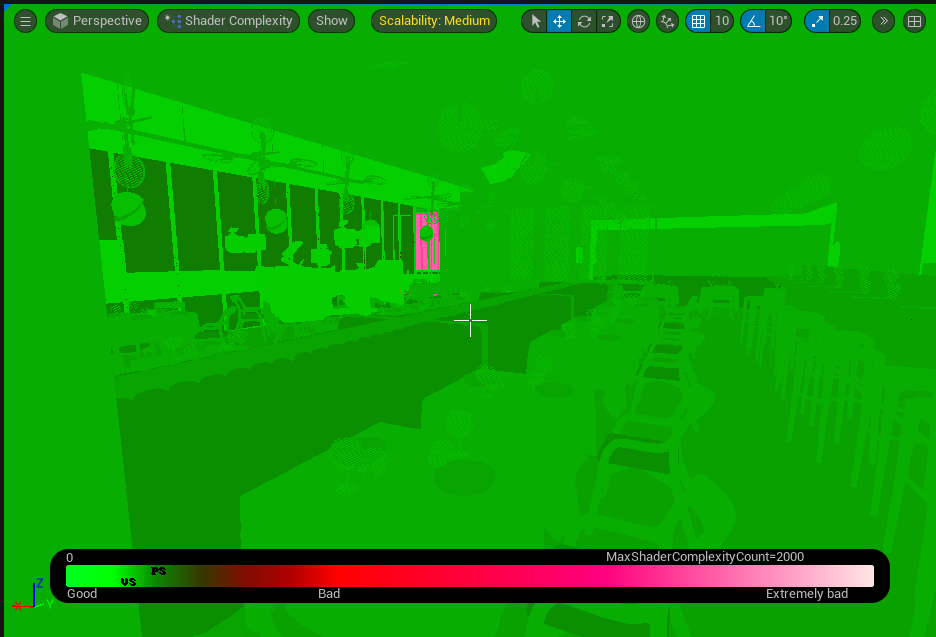
Shader complexity
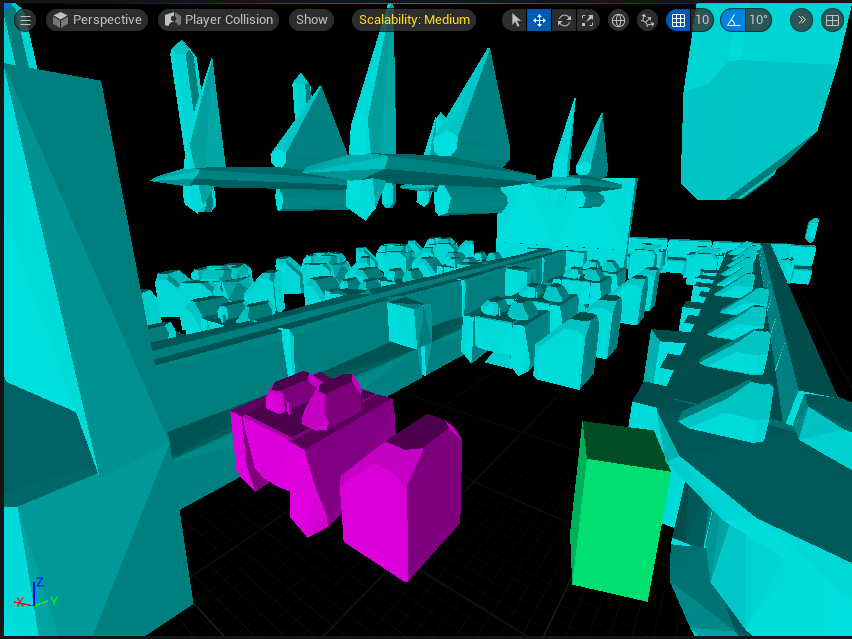
Player collision
AB test
this command tests between two console command settings. Example abtest r.screenpercentage 10 100 will test screen percentage 10% and 100% and provide rudimentary results
LogConsoleResponse: Display: 13.8509ms ( 494 samples) A = 'r.screenpercentage 10'
LogConsoleResponse: Display: 18.4659ms ( 506 samples) B = 'r.screenpercentage 100'
LogConsoleResponse: Display: A is 4.6150ms faster than B; 0% chance this is noise.
Workflow
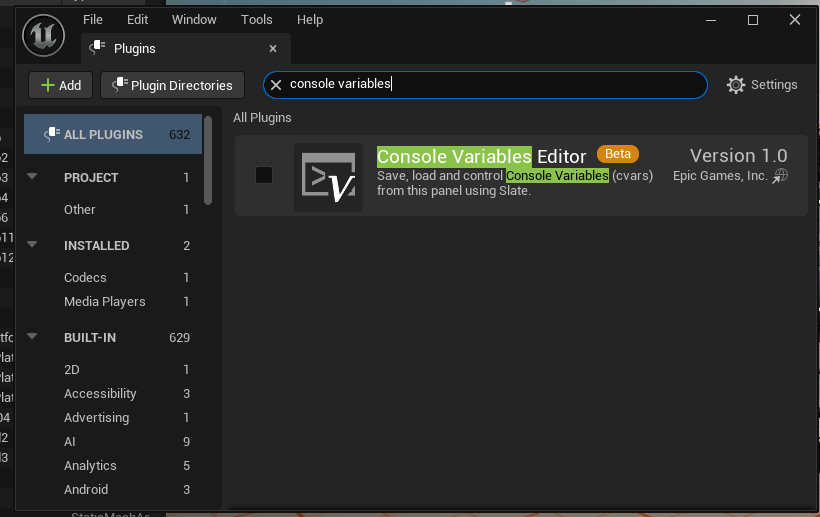
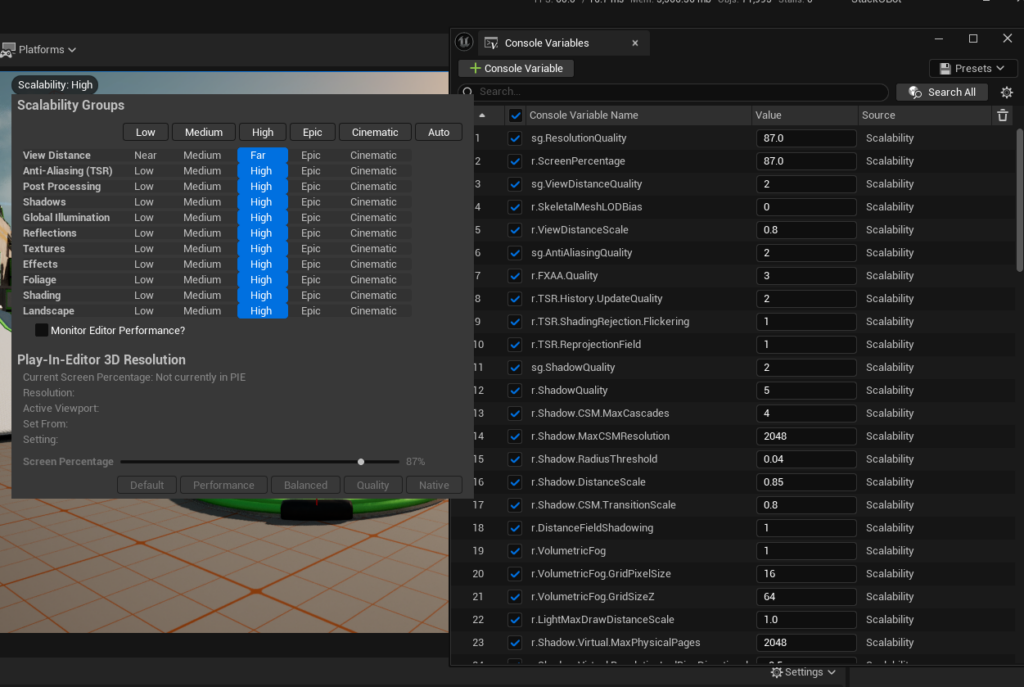
Console variables editor
Improving performance
Significance Manager is a tool to work on level of detail of actors.
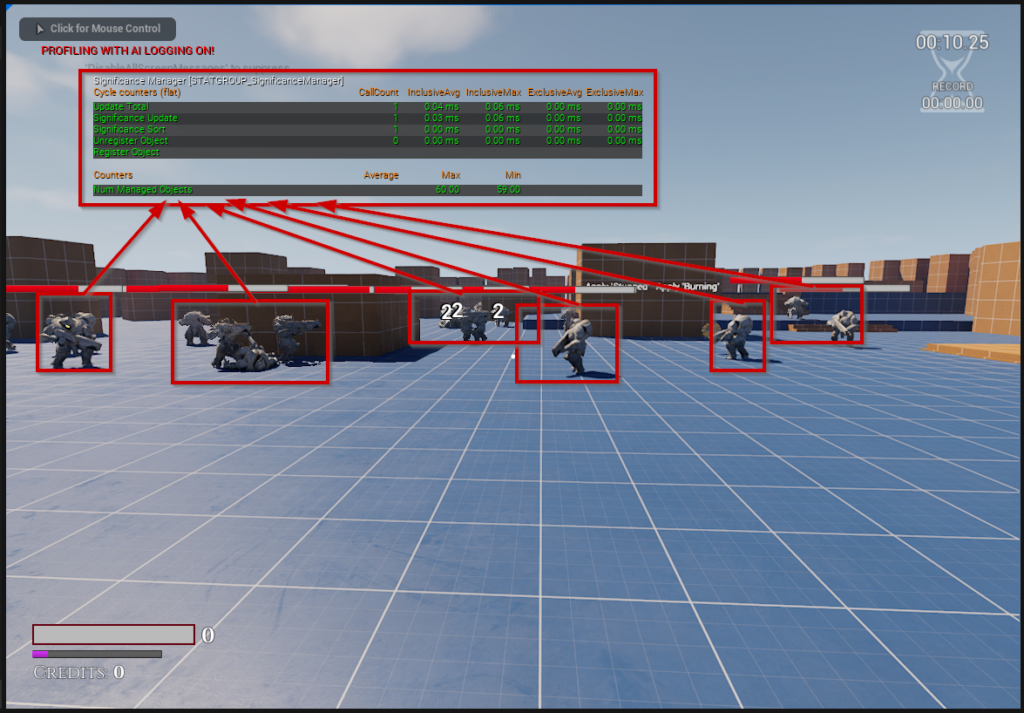
In this screen we the significance manager stats, it’s update, sort, register times
Leave a Reply